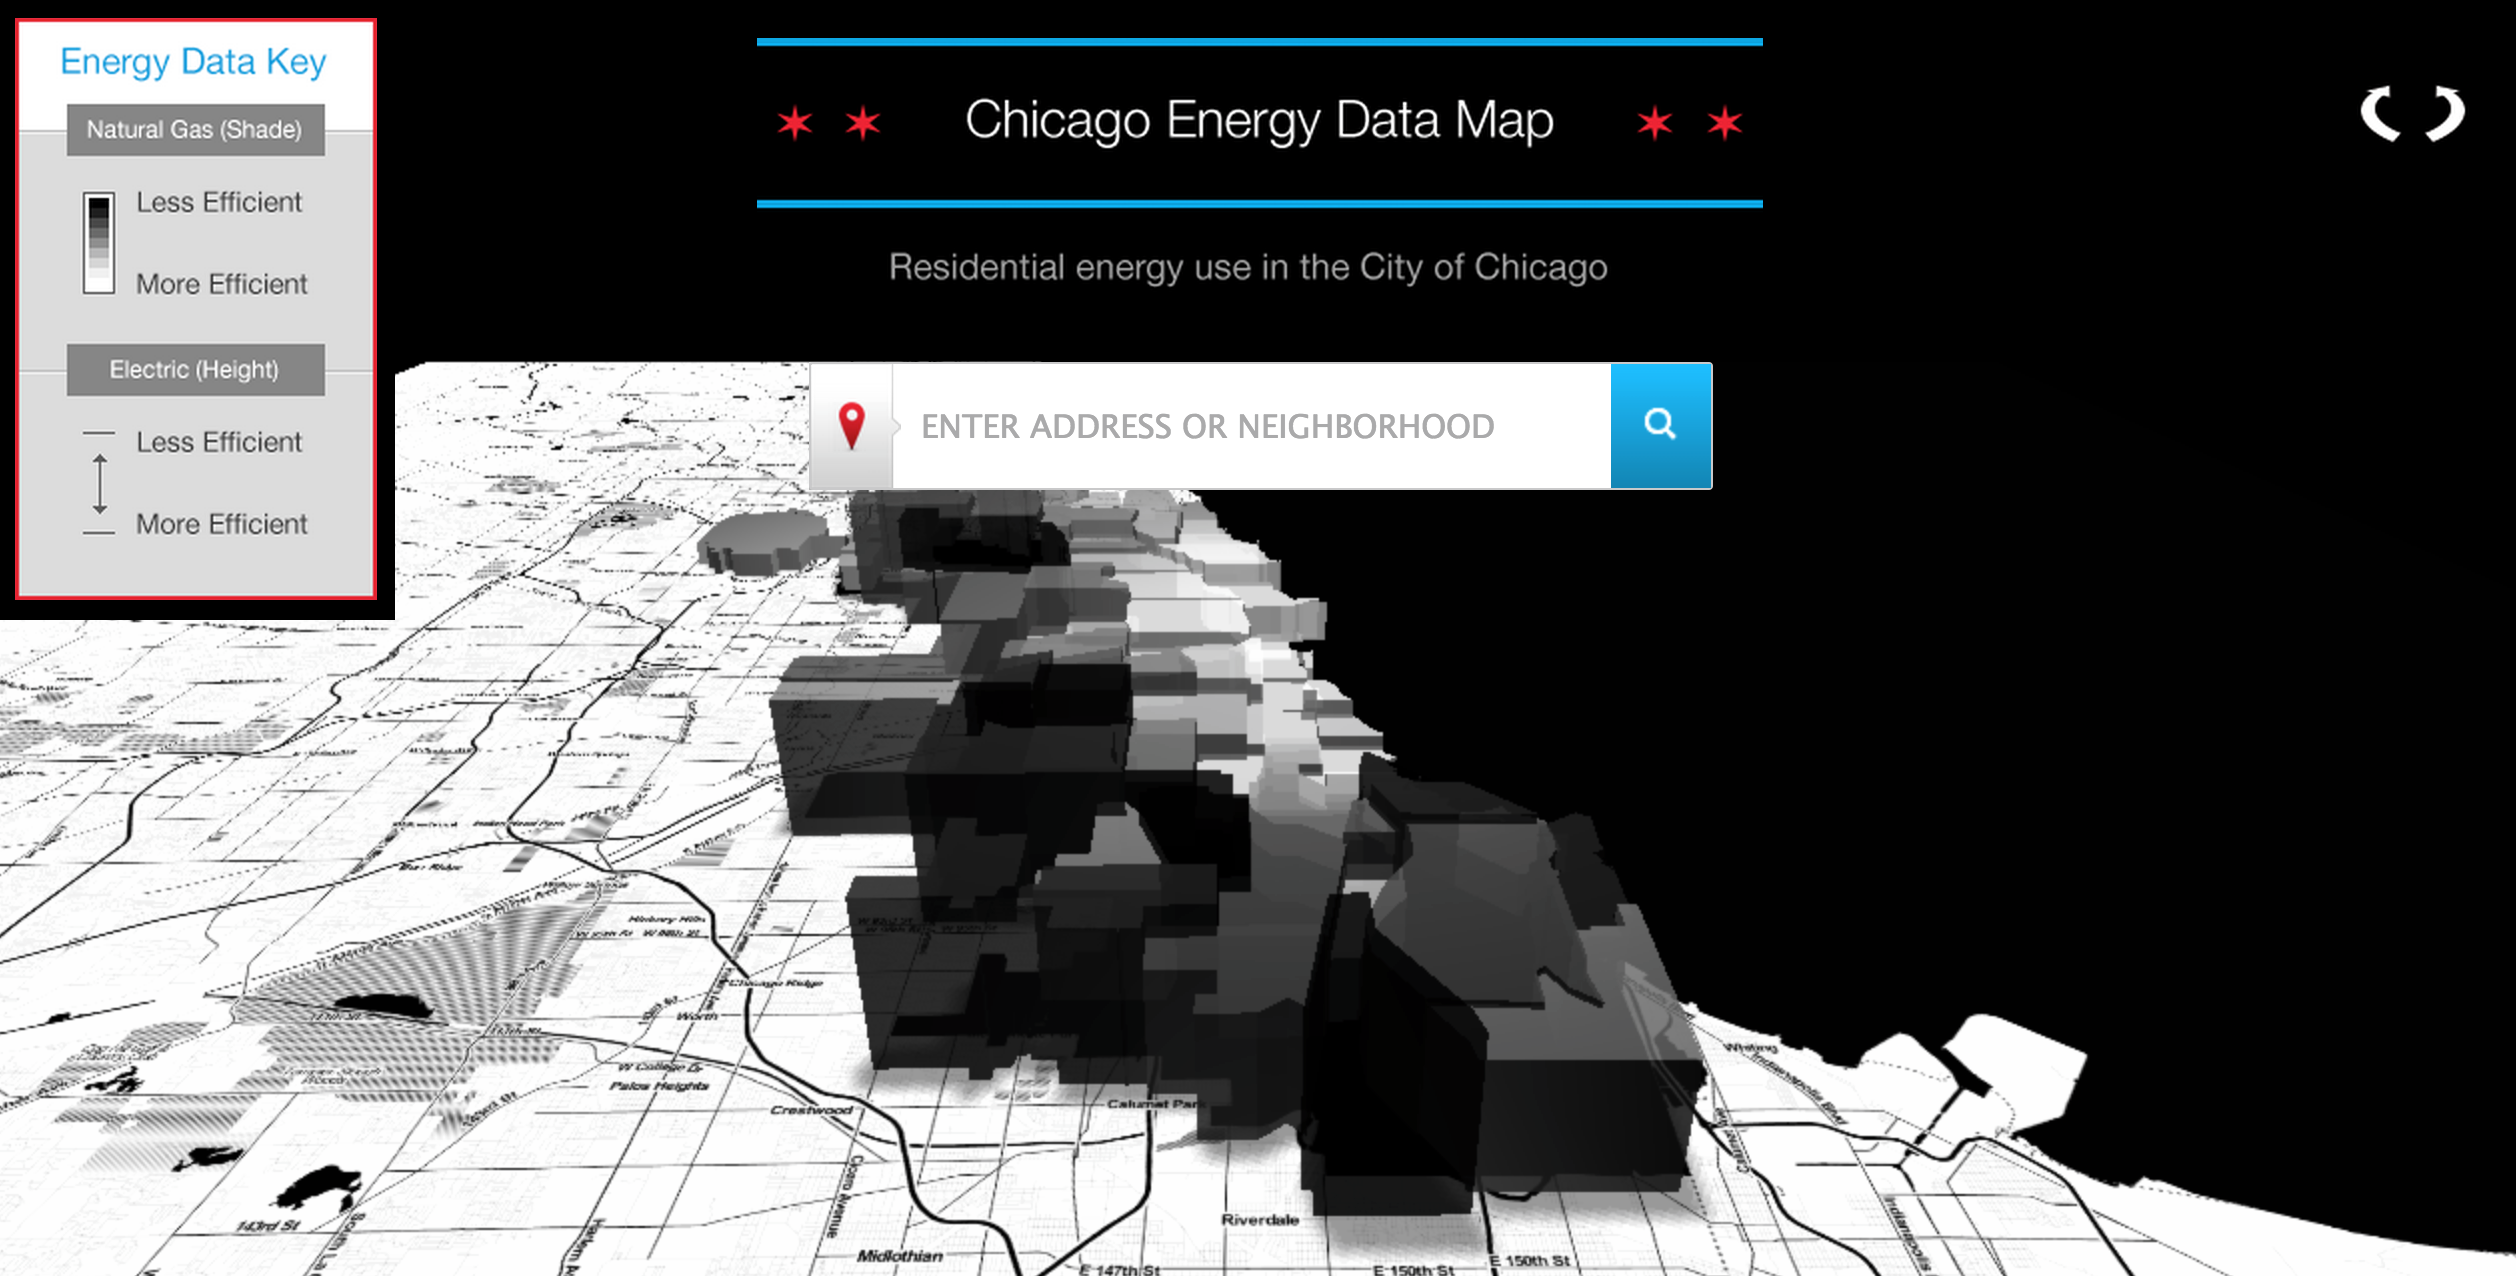
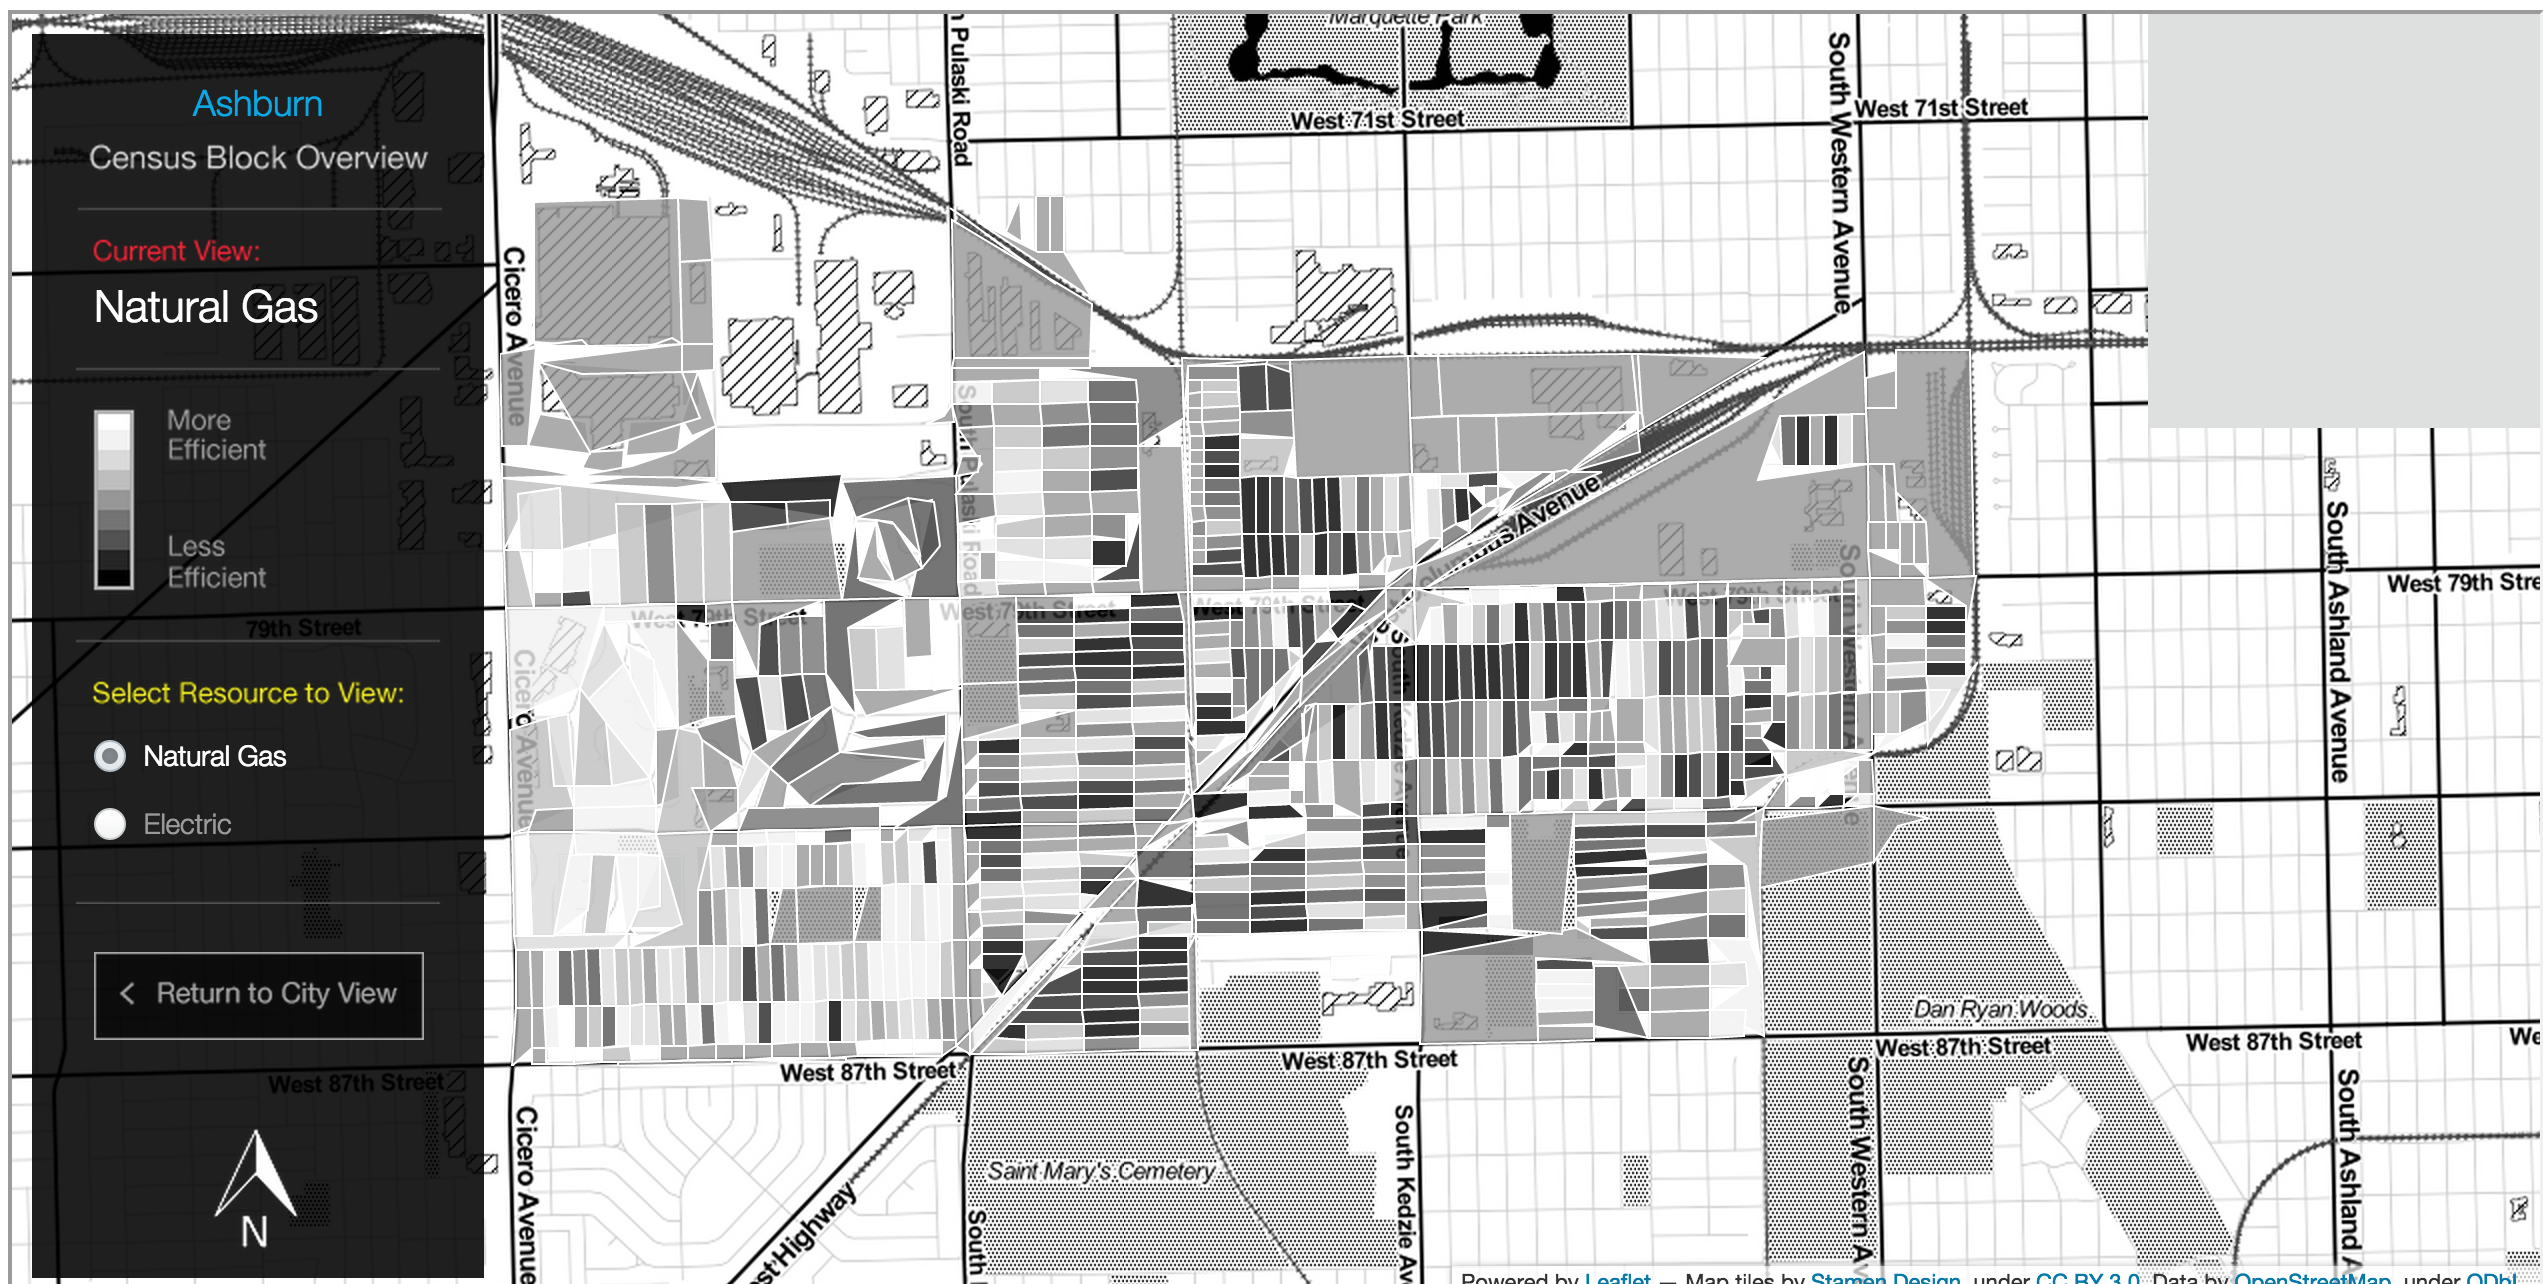
The Chicago Energy Data Map is a visualization of all residential natural gas and electric energy use — both by neighborhood and by census block — for the City of Chicago in 2010. The height of each neighborhood or census block indicates electric energy consumption while the color is indicative of natural gas consumption.
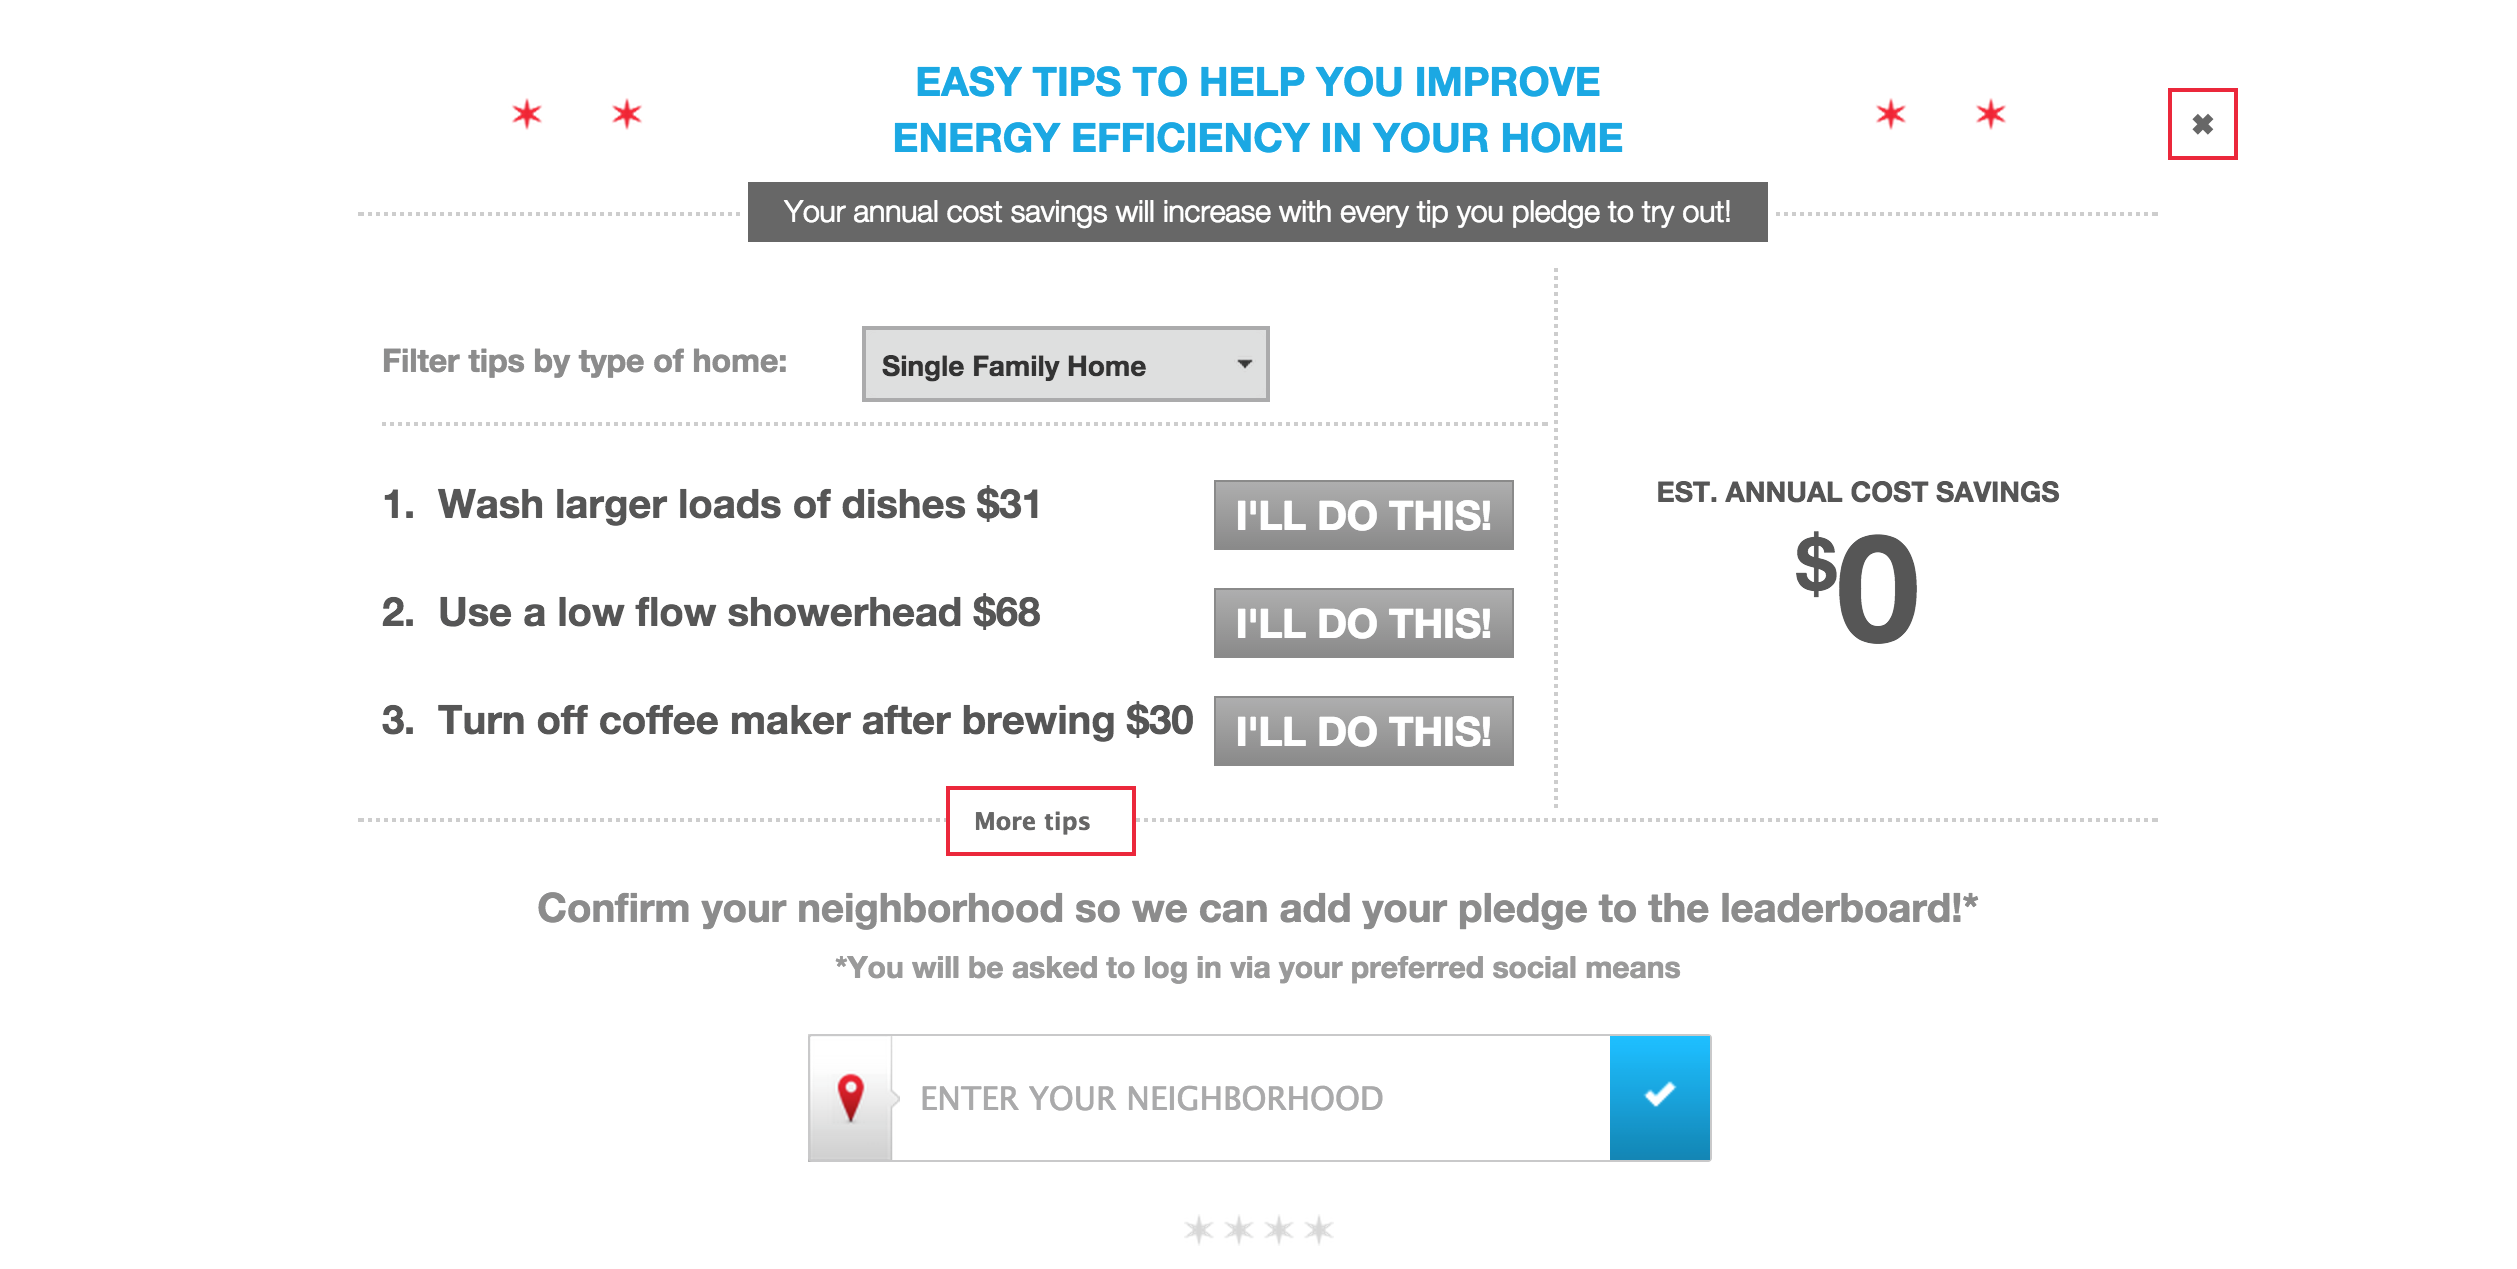
The purpose of this visualization is to allow the viewer both a bird's eye view, as well as a neighborhood detail view, of energy consumption patterns in one of our nation's largest cities. Further, users can review energy efficiency tips and Chicagoans can pledge to make improvements to the efficiency of their homes on behalf of their respective neighborhoods.
This project is a collaborative effort between the Datascope Analytics, IDEO, the Civic Consulting Alliance, and the City of Chicago.